Serverless applications on AWS using Lambda with Java 25, API Gateway and Aurora DSQL – Part 2 Initial performance measurements
Introduction
In part 1, we introduced our sample application. In this article, we’ll perform Lambda function initial performance measurements of the sample application using Lambda with Java 25 API Gateway and Aurora DSQL without any optimizations.
Measurements of cold and warm start times of the Lambda function of the sample application with JDBC and Hikari connection pool
In the following, we will measure the performance of our GetProductByIdJava25WithDSQL Lambda function mapped to the GetProductByIdHandler, which we will trigger by invoking curl -H “X-API-Key: a6ZbcDefQW12BN56WEDQ25” https://{$API_GATEWAY_URL}/prod/products/1. I assume that you have already created some products as described in part 1. Two aspects are important to us in terms of performance: cold and warm start times. It is known that Java applications, in particular, have a very high cold start time. The article Understanding the Lambda execution environment lifecycle provides a good overview of this topic.
The results of the experiment are based on reproducing more than 100 cold starts and about 100,000 warm starts with the Lambda function GetProductByIdJava25WithDSQL. We retrieve the already existing product with ID=1 for the duration of about 1 hour. We send several hundred requests in parallel with some pauses in between. With that, the existing execution environments will be destroyed, and we will experience new Lambda cold starts. We give the Lambda function 1024 MB of memory, which is a good trade-off between performance and cost. We also use (default) x86 Lambda architecture. For the load tests, I used the load test tool hey, but you can use whatever tool you want, like Serverless-artillery or Postman.
Java Compilation Options for AWS Lambda
With AWS Lambda now supporting Java 25, there have been some changes for the Java compilation options, especially tiered compilation. Java’s tiered compilation is a just-in-time (JIT) optimization strategy that employs multiple compiler tiers to enhance the performance of frequently executed code progressively using runtime profiling data. Since Java 17, AWS Lambda has modified the default JVM behavior by stopping compilation at the C1 tier (client compiler). This minimizes cold start times for function invocations for most functions. Although for compute-intensive functions with a long duration, customers can benefit from tuning tiered compilation to their workload. Starting with Java 25, Lambda no longer stops tiered compilation at C1 for SnapStart and Provisioned Concurrency. This improves performance in these cases without incurring a cold start penalty. This is because tiered compilation occurs outside of the invoke path in these cases.
I’ve found out that stopping compilation at the C1 tier (client compiler) provides the best trade-off for this type of application. This is also true when using SnapStart and priming techniques, which we’ll cover in the next article. But this may not be the best choice for other applications. So you simply need to measure to find the right compilation settings for your application. I also show the Lambda performance measurements with the default compilation behavior described above in one of the next articles.
That’s why we set XX:+TieredCompilation -XX:TieredStopAtLevel=1 compilation option. To do so, we have to set it in template.yaml in the JAVA_OPTIONS environment variable as follows:
Also, please make sure that SnapStart isn’t configured or disabled as shown above for the initial measurement. We’ll cover it in the next articles.
Please note that I measured only the performance of the Lambda function. On top of that comes also the latency of the trigger – in our case, the API Gateway REST API.
I did the measurements with java:25.v19 Amazon Corretto version, and the deployed artifact size of this application was 17.150 KB.
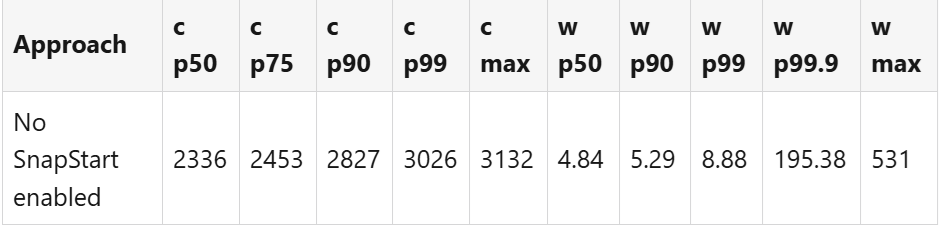
Cold (c) and warm (w) start time with -XX:+TieredCompilation -XX:TieredStopAtLevel=1 compilation in ms:
Measurements of cold and warm start times of the Lambda function of the sample application with Hibernate and Hikari connection pool
The same holds true for this application, but for the application aws-lambda-java-25-hibernate-aurora-dsql. We will measure the performance of our GetProductByIdJava25WithHibernateAndDSQL Lambda function mapped to the GetProductByIdHandler, which we will trigger by invoking curl -H “X-API-Key: a6ZbcDefQW12BN56WEHADQ25” https://{$API_GATEWAY_URL}/prod/products/1.
I did the measurements with java:25.v19 Amazon Corretto version, and the deployed artifact size of this application was 42.333 KB.
Cold (c) and warm (w) start time with -XX:+TieredCompilation -XX:TieredStopAtLevel=1 compilation in ms:
Conclusion
In this article, we made the first Lambda performance measurements (cold and warm start times) of both of our sample applications. We observed quite a large cold start time, especially if we use the Hibernate ORM framework. Using this framework also significantly increases the artifact size. In the next parts of the series, we’ll introduce approaches and techniques to reduce the Lambda cold start time with AWS Lambda SnapStart (including various priming techniques) and GraalVM Native Image, and also measure their impact on the Lambda warm start time for both sample applications. Stay tuned!
Please also watch out for another series where I use a NoSQL serverless Amazon DynamoDB database instead of Aurora DSQL to do the same Lambda performance measurements.